The Eureka County Economy
Mining jobs continue to surpass all other Eureka County jobs combined, with 3,466 of the total 3,806 jobs in the county reported by the Nevada Department of Employment Training and Rehabilitation in 2005. Mining employment dropped slightly in 2003 and 2004, but rose again in 2005.
Government is the second-largest employment category in the county, with 178 jobs reported in 2005. Of these, local government is the largest employer, with 168 jobs in 2005. Government employment dropped over the four-year period shown in the following chart and table, from 204 government jobs in 2002 to 178 in 2005. Accomodation and food service jobs rose from in the four-year period from 25 to 38 jobs.
Comparison with 1993-2000 Employment Data in 2003 Socioeconomic Conditions and Trends Update.
The 2003 Socioeconomic Conditions and Trends Update showed employment in several major industries for the period 1993-2000. Since that report was prepared, some key ways of tracking industrial employment have changed. In 2001, federal and state agencies began classifying industrial employment by the North American Industry Classification System (NAICS), rather than the Standard Industrial Classification (SIC) that was used from 1969-2000.
In the new system, it is possible to break down employment more precisely by sub-industry, however, the industries listed in the two classification systems are not exactly the same. This makes it difficult to compare numbers under the two systems. In addition, this more precise sub-classification makes it so that in an area like Eureka County, with a small population and industrial base, all of the employment in a particular industry may be in only one enterprise.
The agencies then suppress these numbers in order to maintain business confidentiality. The result of this suppression is that in Eureka County, data about most industries is suppressed. The Nevada Department of Employment Training and Rehabilitation (DETR) suppresses less data than the Department of Commerce's Bureau of Economic Analysis (BEA), but the state agency also does not include some key employment sectors in Eureka County, most notably agriculture, and counts the number of jobs differently in some other ways.
For all these reasons, it was not possible to build a single table or chart showing employment numbers for the entire period 1993-2005: the systems of measurement have changed too much over the period. The table showing employment from the 2003 Update is reproduced in this report, however, to give the reader some sense of the type of industrial employment in Eureka County over the entire 1993-2006 period.
In the 13-year period shown in the firest table listed below, the unemployment rate in Eureka County peaked at 10.7 % in 1994, well above state and national unemployment rates. The unemployment rate fell to a low of 2.5% in 2000, then rose again to 4.9 percent in 2006., making the County's 2006 unemployment rate lower than the national rate but higher than the Nevada rate. The mining sector appears to affect not only the unemployment rate in the county, but also the size of the labor force itself. The years 1996-1998 were the three biggest years in the county for mining employment, also services and trade employment.
Unemployment rates reflect these jobs, falling from the 1994 high of 10.7% to 5.3% in 1998, while during the same period the overall size of the labor force grew from 750 in 1994 to 950 in 1998. Subsequent to 1998, when mining employment began to decline, the overall size of the labor force declined, from the 1998 high of 950 to 683 in 2005. This decline in the overall size of the labor force, then, contributed to a continued drop in the county unemployment rate. Fewer jobs were available, yet there were also fewer workers seeking jobs.
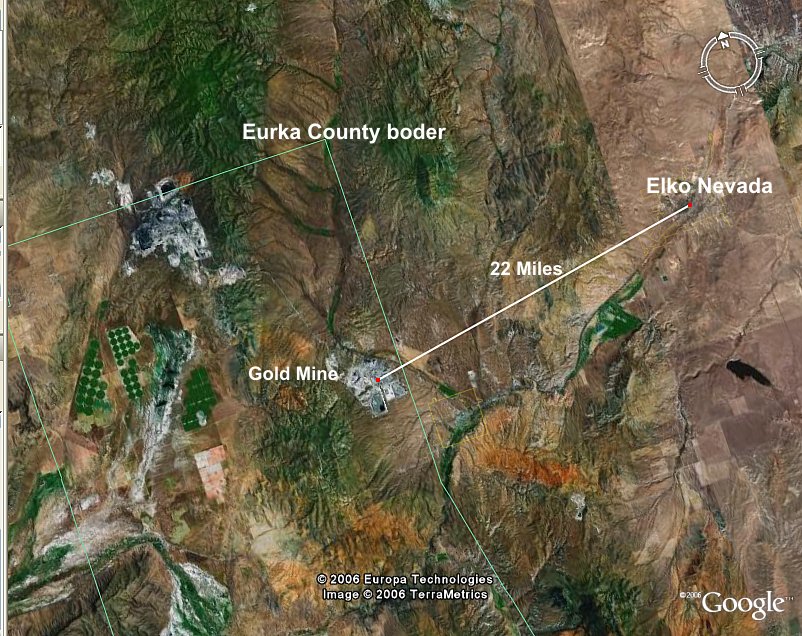
Eureka County has more jobs than workers. This is a result of the location of the county's biggest employers, Newmont Mining Company's Carlin Operations, and Barrick Goldstrike's Goldstrike Mine. Both these operations are in the far northern end of the county, closer to the Lander County and Elko County population centers of Battle Mountain, Elko and Carlin than to Eureka County's population centers of Crescent Valley and Eureka. The mines are headquartered in Elko County, and workers are transported to the mine sites from those towns. The last table listed below along with the line graph illustrate this imbalance of jobs vs. resident labor force in Eureka County
 The chart at left shows commuting patterns in Eureka County in 2000. This information is gathered in the "long form" U.S. Census questionnaire, so it cannot be updated until after the decennial 2010 U.S. Census. The table shows that the most common commute pattern in 2000 was into Eureka County from Elko County - this reflects commutes to the two large mines in northern Eureka County by workers residing in Elko County. Although overall numbers are smaller, there also are many long-distance, out-of-county or even out-of-state commutes, to and from communities as far away as San Diego, California and Montrose in western Colorado.
* On reviewing a draft of the 2003 report, reviewer Susan Fye of Crescent Valley noted that the number given in this chart of nine (9) people commuting from Eureka County to Lander County in 2000 seemed very low, given that many Crescent Valley residents commute from the town of Crescent Valley in Eureka County to work at the Cortez Mine which is located in Lander County. A 1/9/04 telephone interview with Celia Boertlein in the Migration Statistics Branch of the U.S. Census Bureau indicated the following possible reasons for this low number:
- The question on workplace location was Question #22 in the "long form" Census questionnaire, which was only mailed to a portion of the population. In Eureka County, the portion of the population that filled out the long form was 41.9% of the total population. Therefore, the number of nine commuters to Lander County was based upon only three or four sample cases. The recipients of the long form questionnaire were not selected based upon occupation, so those working in the mining industry could have been "undersampled" in the count.
- The wording of Question #22 may also have led to the low count. In the question, respondents were asked to identify the location of their workplace by street address, name of city, town, or post office, name of county, and zip code. The mailing address and the zip code of the Cortez Mine are in Crescent Valley, so if respondents did not know, or did not fill out the "name of county" box, then the zip code, post office, or town information would have placed the location of the Cortez Mine workplace in Eureka County when the questionnaire results were tabulated.
- Since the Cortez Mine, while located in Lander County, is close to the county boundary and has a mailing address in Eureka County, some respondents might have mistakenly placed the location of the workplace in Eureka County.
|
 The chart to the left and the line graph listed below show median household income for Eureka County over a 30-year period, both adjusted for inflation (2006 dollars) and unadjusted. A household is defined as all people who occupy a housing unit, whether related or not, and this income measurement usually is lower than family income since households often consist of just one individual. Real, inflation-adjusted income rose to its highest point in 1998, then fell again. The bar graph listed below shows a comparison of median household income in Nevada, Eureka County, and nationwide in 1999 and 2003. Median household income in Nevada as a whole was significantly higher than in Eureka County in both years. The county's median household income is very close to that of the nation as a whole in 1999, but the county fell behind in 2003.
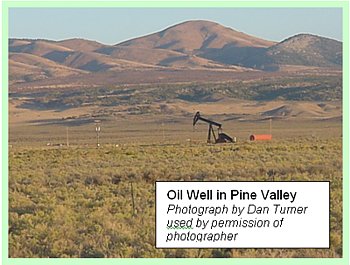 Eureka County's Blackburn Field was Nevada's second highest volume producer for the third year in a row in 2004, averaging 68 barrels of oil and 1,173 barrels of water per day. The Nevada office of the BLM held four oil and gas lease sales in northern Nevada in 2004. The highest bids were for leases in Nye and White Pine Counties. According to the Nevada Bureau of Mines, discovery of oil in the "Wolverine" area of western Utah coupled with the high price of oil has sparked renewed interest in oil exploration in eastern Nevada and western Utah. One of the larger projects is Eden Energy Corporation's Noah Project. In 2004, Eden Energy of Vancouver, British Columbia, acquired a Participation Agreement with Nevada-based Cedar Strat and also acquired about 211,000 acres in leases covering the Diamond Mountains along the border between Eureka and White Pine Counties.
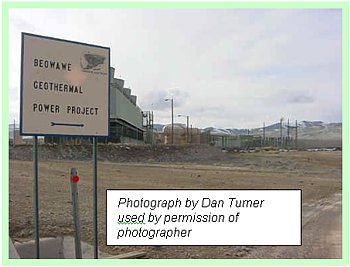 Eureka County contains numerous warm and hot springs which may be potential geothermal resources. A 2000 map prepared by the Nevada Bureau of Mines and Geology,
Nevada Geothermal Resources, shows over 40 hot or warm springs or wells in Eureka County. Beowawe Power LLC operates a 16.6 megawatt geothermal power plant at Beowawe. The plant is situated on the Lander/Eureka County line. While a part of the facility is in Eureka County, the main building is in Lander County, and the company holds a business license in Lander County. The company continues to explore the potential of expanding the plant, and received a test drilling permit in 2005 from the Nevada Division of Minerals.
Eureka County contains numerous warm and hot springs which may be potential geothermal resources. A 2000 map prepared by the Nevada Bureau of Mines and Geology,
Nevada Geothermal Resources, shows over 40 hot or warm springs or wells in Eureka County. Beowawe Power LLC operates a 16.6 megawatt geothermal power plant at Beowawe. The plant is situated on the Lander/Eureka County line. While a part of the facility is in Eureka County, the main building is in Lander County, and the company holds a business license in Lander County. The company continues to explore the potential of expanding the plant, and received a test drilling permit in 2005 from the Nevada Division of Minerals.