1.0 INTRODUCTION

As a part of efforts to assess the potential impacts upon Eureka County of construction and operation of a Nuclear Waste Repository at Yucca Mountain, Eureka County has developed and maintains an accurate picture of existing socioeconomic conditions and trends in the county. Seven previous Socioeconomic Conditions and Trends Reports have been completed: one in 1994, 2003, 2006, 2012-2014, and 2015. This is an update to the 2015 report. The update is divided into eight sections: The Introduction, Population and Housing, the Economy, Local Government Fiscal Conditions, Education, Social Indicators, Natural Resources, and Conclusions. Together, the seven documents present a wide range of information that shows socioeconomic conditions and trends in Eureka County for a period exceeding twenty years. The main data sections (Sections 2.0-7.0) of the report are summarized below, with more detailed information offered in the body of the report.

Located in northeastern Nevada, Eureka County was established in 1873. The County covers 4,182 square miles. Geography is typical basin and range topography, with long, mostly north- south trending, alluvium-filled valleys separated by mountain ranges. Elevations range from a high of around 10,461 feet at the Summit Mountains in the Monitor Range to about 4,000 feet elevation on the floors of several of the lower basins. Principal communities are the county seat, Eureka, in the southern end of the county and the towns of Crescent Valley and Beowawe in the north. The Humboldt River winds through the northern part of the county. This is a major transportation corridor both historically and in the present. Thousands traveled the emigrant trail along the Humboldt River in the nineteenth century; now the corridor holds Interstate Highway 80, as well as Union Pacific railroad tracks. U.S. Highway 50 provides access to the southern end of the county and to the county seat.


POPULATION AND HOUSING

Eureka County population was 1,959 persons in 2016 declining slightly to 1,932 in 2017. Since 2006 the County population increased 32.3 percent or 472 persons. The County's average annual population growth over the years 1993-2017 has been 1.2 percent, a positive growth rate overall. Population fell sharply in 1994, increased to a high of an estimated 1,895 persons in 1998, declined again reaching a low of 1,458 persons in 2007, then rose to an estimated 2,024 persons in 2013 then leveling off through 2017. As a comparison, the average annual population growth rate of the state of Nevada over the period 1990-2017 was 4.3 percent. In Eureka County the greatest part of population change is due to in-migration.

As mining operations and exploration move south along an extension of the Carlin and Battle Mountain trends, future growth in Eureka County and more specifically the Diamond Valley area and the Town of Eureka is increasingly being influenced by new mineral development activity. With Barrick’s Cortez Complex, Horse Canyon, and Mill Canyon project to the north and Midway Gold operations to the south, the Town of Eureka and Diamond Valley are increasingly becoming the geographic center of major gold and silver development activity. Additionally, industrial mineral development could also have a significant impact on the Town of Eureka and Diamond Valley. As a result, population growth should increase substantially over the next decade.

Several mining projects with strong prospects of reaching full operations in and around the Diamond Valley/Town of Eureka area have more than 1,200 projected employees for operational phases not including any of the Barrick’s existing operations at Cortez Hills and Bald Mountain. As Barrick’s operations move further south along the Carlin trend, an increasing number of employees will choose to live in the Diamond Valley/Town of Eureka area.

Eureka County has an extremely low population density - only .46 persons per square mile, as compared to 27 persons per square mile for Nevada as a whole, and 81.4 persons per square mile nationwide. Approximately 56 percent of the 2017 county population of 1,932 resided in the Eureka area and Crescent Valley. Overall housing units in Eureka County increased from 801 units in 1993 to 1,013 in 2017. Manufactured housing remains the dominant housing type, accounting for 61.7 percent of county housing in 2017.


THE ECONOMY

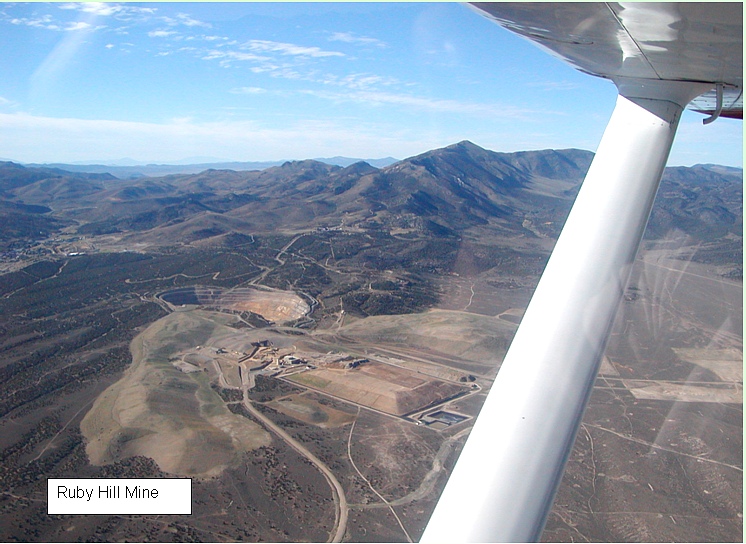
Gold mining continues as the principal economic engine of Eureka County. Over the period 1993 - 2017 there were three primary gold producing areas in the County. In 2002 Eureka County produced 37 percent of all gold produced in Nevada, and in 2012 the county produced 33 percent of all Nevada gold. By 2016 gold production dropped to 27.34 percent. Two mine complexes in northern Eureka County continue to be some of the most productive mines in Nevada and indeed in the entire country, with Newmont Mining Corporation's Carlin Trend mines producing nearly 1.5 million ounces of gold in 2016, and Barrick Gold Corporation's Betze-Post Mine producing over 934,000 ounces in that year. Barrick is developing and has begun to mine deposits in the Cortez Hills and further south in Horse Canyon area. Mining jobs continue to surpass all other Eureka County jobs combined, with 4,092 of the total 4,507 jobs in the County reported by the Nevada Department of Employment Training and Rehabilitation in 2017.

During the late 1990's, lower gold prices caused many Nevada mines to scale back exploration and to scale back or temporarily close some operations. Since then the price of gold has again risen to over $600 per ounce in 2006 and reaching a peak of $1,900 in 2011 declining to $1,350 per ounce in 2018. Because of higher gold prices, several Nevada gold mines are expanding both operations and exploration. As of the end of 2017 Newmont Mining Corporation's Carlin trend mines had almost 14.83 million ounces of gold in proven and probable reserves.

Barrick’s Cortez Hills mine located in southern Crescent Valley is producing gold from the leach pad and has started stripping the pediment deposit that will join the Cortez Hills pit to make one open pit. The Cortez Pipeline project located just over the Eureka County line in Lander County continues producing gold. With 2018 production of 1.73 million ounces at total all-in sustaining costs of $610-$650 per ounce, Cortez is one of the world’s largest and lowest cost gold mines, and the property also has excellent upside exploration potential. Barrick’s Horse Canyon/Cortez unified project (Gold Rush Deposit) is the company’s next flagship project located six kilometers from the Cortez mine, and is one of the largest and highest-grade gold discoveries of the last decade. 2017 proven and probable reserves stand at 10.09 million ounces. Exploration continues in the Cortez District. Eureka Moly, LLC plans to develop the Mount Hope project approximately 23 miles northwest of Eureka. The 80-year Mount Hope Project will have a 24-month construction phase, 44 years of mining and ore processing, 30 years of reclamation, and five year of post-closure monitoring. The Mount Hope ore body contains approximately 966 million tons of molybdenite ore that would produce approximately 1.1 billion pounds of recoverable molybdenum during the ore processing time frame. The mine plans to employ approximately 400 during operations.

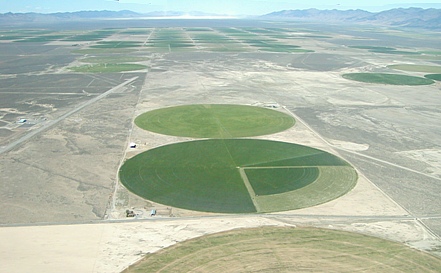
Agriculture remains a steady economic element in Eureka County. Unlike mining, agriculture has been a consistent base of economic activity in Eureka County, particularly in the Diamond Valley area. The agricultural economy consists of four sectors: range beef cattle, alfalfa hay, timothy hay, and native hay. There were 101 farms or ranches in the county in 2012, producing about $36 million in agricultural products. This is an increase in the number of farms/ranches from 73 in 2002. The average per farm/ranch market value of agricultural products sold in 2012 was $356,636. The cattle and calves inventory has fluctuated between 18,000 and 25,000 head over the last several years. Total hay production has declined somewhat since 2011. Extended drought conditions have had an impact on both hay and cattle numbers.

The unemployment rate in Eureka County peaked at 10.7 percent in 1994, well above state and national unemployment rates. In subsequent years the unemployment rate fell to a low of 2.5 percent in 2000, then rose again to 7.6 percent in 2010. By 2017, the County unemployment rate dropped to 2.6 percent.

Eureka County has more jobs than workers. The three largest mines in the County are in the far northern end of the county, closer to the towns of Elko and Carlin than to Eureka County's population centers of Crescent Valley and Eureka, so most workers commute to the mines from Elko County communities. Some Crescent Valley residents, however, work at the Cortez Complex Mine, a portion of which is within Lander County. The mining sector appears to affect not only the unemployment rate in the county, but also the size of the labor force itself.

Various income measurements for Eureka County show improving economic conditions. Eureka County per capita income was higher than that of the state overall through 2009. The per capita income reached $40,876 in 2008 before falling to $32,876 due to the national economic downturn and an upward adjustment in Eureka County population. The 2016 per capita income was $34,159. Household income increased from $45,240 in 2005 to $70,000 in 2016.

Total taxable sales in Eureka County are volatile moving up and down based upon activity in the mining sector. Taxable sales peaked in 2007 at just over $500 million. Between 2008 and 2014 taxable sales fluctuated between $370 million and $266 million. In fiscal year 2017 they increased to $292.1 million a rebound from a recent low of $235.1 million in 2016. Taxable sales for mining related items remain by far the county's largest generator of taxable sales. In 2017, metal mining made up a majority of the county's taxable sales. Other top sectors in the county include wholesale trade/durable goods, industrial and commercial machinery, chemical products, and business services.

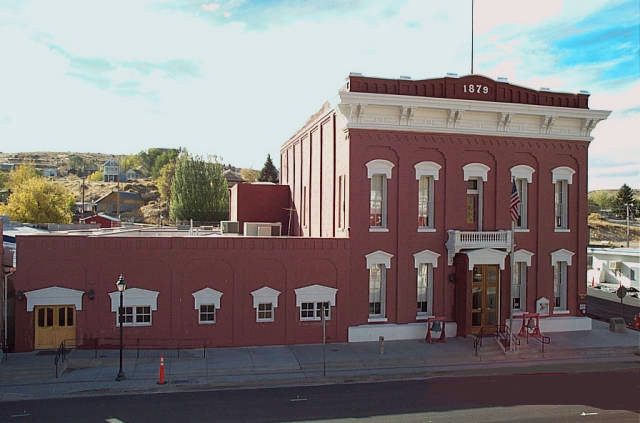
In the tourism sector, visitation to the Eureka Sentinel Museum has increased over the two decades since its opening, but not steadily. Visitation to the museum reached a high of 5,083 visitors in 1995, and then declined in subsequent years declining to a low of 3,966 in 2016 before rebounding slightly in 2017. Room tax collections climbed continuously through 2007 reaching a peak of $100,110 in 2007. From 1999 to 2013 room tax revenues almost doubled before dropping to 2001-2005 levels. Gaming license collections remain relatively stable fluctuating from high of $174,203 to a low of $55,238 in 2016. From 2013-2017 gaming tax declined nearly 50 percent. Recent declines in gaming tax revenues are partly attributed to national economic conditions. Eureka County continues to pursue diversified economic development including tourism.


LOCAL GOVERNMENT FISCAL CONDITIONS

The Eureka County government provides a full range of services including police and volunteer fire protection; the construction and maintenance of sanitation, water and sewer facilities; recreational facilities including parks, swimming pool, museum, opera house, and fair and rodeo grounds; library; judicial services; economic development; medical facilities; road construction and maintenance; television services; Diamond Valley weed and rodent control; and senior citizen facilities. The unincorporated towns of Eureka and Crescent Valley are blended component units of the County government.

In 2017, principal officials of Eureka County consisted of a three-member Board of County Commissioners, an Auditor/Recorder, Clerk/Treasurer, Assessor, District Attorney, Sheriff, a Justice of the Peace, in Eureka, a Public Works Director, a Facilities Manager, two Senior Center Coordinators, and an EMS Coordinator. In 2018 Eureka County had 74 full-time equivalent employees and 31 part-time seasonal employees which represents a significant reduction in the workforce.

Ad valorem taxes and intergovernmental revenues continue to be the two main sources of Eureka County revenues, with ad valorem taxes accounting for 56.4 percent and intergovernmental revenues accounting for 35.6 percent of total 2017 revenues. In 2017 Eureka County spent less than it collected.

Eureka County has several fiscal policies in place designed to cushion the impacts of slowdowns or changes in the major industry. The County has a policy of retaining large ending balances and building up reserve funds. There are two reserve funds, a Future Reserve Fund and a Building Operation and Maintenance Reserve Fund.

In 2017 the county expended a total of $14,189,882, a decrease from 2014. The decrease was due to a number of required one-time capital improvements for County facilities and services which were previously funded by intergovernmental grants. The General Government and Public Safety functions within the County's General Fund, together with the Road Fund, are the largest County expenditure categories. General Fund expenditures make up 71.1 percent of County expenditures.


EDUCATION

The Eureka County School District is one of the smallest districts in the state. The district operates the Eureka Elementary School and the Eureka Junior-Senior High School in Eureka, the former with a capacity of 240 students and the latter with a capacity of 240 students. Crescent Valley Elementary School in Crescent Valley, has a capacity of 180 students. High school students from Crescent Valley and Beowawe attend Battle Mountain High School. Pine Valley high school students go to Carlin High School. There are no private schools in Eureka County.

In 2005 there were 224 students enrolled in Eureka County schools, and 41 home schooled students. The highest school enrollment during the period 1994 to 2005 was in 1998 with 378 students enrolled, and the lowest enrollment year during the period was 2003, with 220 students enrolled. Public school enrollments have started to rebound reaching 278 during the 2013 school year. The 2017 enrollment increased to 294 students with substantial increases in grades K-6.

Over the period from 2009 to 2017 School District revenues have declined from $19.4 million to $10.4. At the same time District expenditures have remained relatively flat ranging between $8.3 and $10.8 million annually. The revenues and expenditures reflect the current operating conditions where District enrollments have increased slightly with improved economic conditions in the mining sector. Local sources make up 94 percent of the District’s revenues. The largest category is ad valorem taxes, which makes up more than 80 percent of total local support, followed by school support taxes and a motor vehicle privilege tax. In 2004 Eureka County voters passed a $6 million school bond to fund expansion and retrofitting of the Eureka County High School. As of 2011, Eureka County School District has no debt service requirements, but has been making substantial capital improvements with available revenues.


SOCIAL INDICATORS

Eureka County towns are relatively isolated, but county and town governments, as well as private businesses, provide a range of services to residents and visitors including two branch libraries, an opera house, a swimming pool, rodeo ground and parks, and two senior citizens centers. William B. Rire Hospital operates two clinics in Eureka County, one in the town of Eureka and one in Crescent Valley. For acute care, Eureka County residents visit hospitals in nearby counties. A new fire station was built in the Town of Eureka in 2009. Arsenic treatment was added to municipal water services in Crescent Valley to achieve safe drinking water standards.

Voter turnout in Eureka County is very high. Voter turnout in the last four general elections averaged 78.3 percent. In 2016, turnout was 88.5 percent of the registered voters casting votes in the general election. In Nevada the percentage of registered voters who voted averaged 76.8 percent in 2016. Just under 44 percent of the Eureka County total population voted in 2016.

The State of Nevada created a uniform crime-reporting program in 1991. The Department of Public Safety obtains crime figures from local jurisdictions in Nevada and publishes them in an annual report, Crime and Justice in Nevada. During 2016 31 "index" crimes were reported in Eureka County. This gives Eureka County a crime rate of 15.82 per thousand population, about half the crime rate for the state of 32.54 (See Table 6-3).

Traffic crashes in Eureka County in 2010 totaled 119, with seven fatal crashes. According to the Nevada Department of Transportation 2010 Nevada Traffic Crashes the top three contributing factors to traffic crashes in Eureka County were "speed too fast for conditions," "animal in roadway (deer)" and "inattentive driving."


NATURAL RESOURCE INDICATORS

Natural Resources are an important element of the Eureka County economy and the quality of life enjoyed by residents. Natural resources support many critical economic sectors, provide for community development, enhance the quality of life by supporting recreational activities enjoyed by residents and visitors. One of the most important natural resources in the County is water. In the arid west, water is a precious and limited commodity. Natural resource indicators include water resources and water use, outdoor recreation, and agriculture.


Population & Housing
Eureka County, Nevada
Socioeconomic Conditions and Trends Update
July 2018

Report Quick Links


Pervious Page

Next Page

Table of Contents
Home