
H. ACCIDENT DATA
Various reports and information were made available from NDOT online or in print. Presented here is information from the Nevada Traffic Crashes report and accident data compiled for individual routes. This data was divided into segments on each study route. Three-year accident data is typically used for design and analysis for intersections and road segments. Three-year data and ten-year data was obtained and presented here to show recent accidents, accident rates, and an overview of historical rates (see Appendix M). During the process of interviewing NDOT and County staff it was determined that some accidents occurred that were not included in the accident data. Some accidents included deaths and major injuries.
NDOT 2002 Accident Report
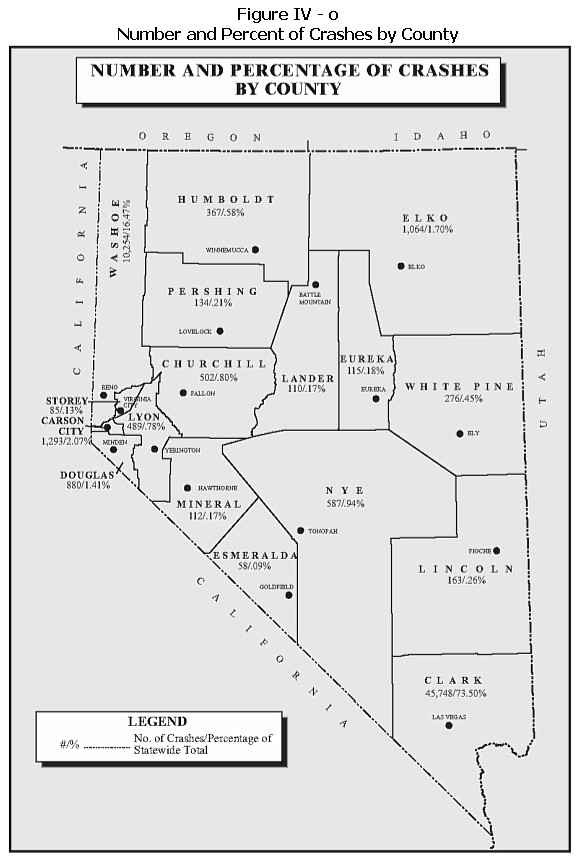
Lumos obtained the most current Nevada Traffic Crashes (2002) report. Tables IV - g & h below display some of the results from that report. Eureka County is shown to represent a very small portion of Nevada accidents in 2002 (0.18%) with 115 accidents out of over 62,000 statewide for the year (also see Figure IV - o below).
Lumos also requested three-year accident data (October 2000-October 2003) and 10-year accident data (January 1994-July 2005). This data was provided by NDOT's Traffic and Safety Division and contains information on accident type, cause, and injuries/fatalities. The typical standard for measuring current operating conditions is three-year accident data is since it reflects current traffic volumes and geometric road changes. Ten-year data are useful to catalog historical trends. Both are presented here.
|